本文介绍了在 \(\LaTeX{}\)
中插入表格的基本语法和一些常用的技巧,并且给出了一些在排版中常用的模板样例。
基本语法
排版表格最基本的 \(\textrm{tabular}\) 环境用法为:
1
2
3
4
5
\begin {tabular}[⟨align⟩]{⟨column-spec⟩}⟨item1⟩ & ⟨item2⟩ & … \\ \hline ⟨item1⟩ & ⟨item2⟩ & … \\ \end {tabular}
其中 <column-spec>
是列格式标记,在接下来的内容将仔细介绍;\(\textrm\&\)
用来分隔单元格;\\ 用来换行;\hline
用来在行与行之间绘制横线。
直接使用 \(\textrm{tabular}\)
环境的话,会 和周围的文字混排 。此时可用一个可选参数
<align> 控制垂直对齐:\(\verb|t|\) 和 \(\verb|b|\)
分别表示按表格顶部、底部对齐,其他参数或省略不写(默认)表示居中对齐。
1
2
3
4
5
6
7
8
9
\begin {tabular}{|c|} center-\\ aligned \\ \end {tabular},\begin {tabular}[t]{|c|} top-\\ aligned \\ \end {tabular},\begin {tabular}[b]{|c|} bottom-\\ aligned\\ \end {tabular} tabulars.
但是通常情况下 \(\textrm{tabular}\)
环境很少与文字直接混排,而是会放在 \(\textrm{table}\) 浮动体环境中,并用
\caption 命令加标题。
列格式
\(\textrm{tabular}\) 环境使用
<column-spec>
参数指定表格的列数以及每列的格式。基本的列格式见下表。
列格式 说明
\(\textrm{l/c/r
}\) 单元格内容左对齐/居中/右对齐,不折行
\(\textrm{p\{<width>\}}\) 单元格宽度固定为
<width>,可自动折行
\(|\) 绘制竖线
\(@\{<string>\}\) 自定义内容 <string>
1
2
3
4
5
6
7
\begin {tabular}{lcr|p{6em}} \hline left & center & right & par box with fixed width\\ L & C & R & P \\ \hline \end {tabular}
表格中每行的单元格数目不能多于列格式里 $ $
的总数(可以少于这个总数),否则出错。
\(\textrm{@}\)
格式可在单元格前后插入任意的文本,但同时它也消除了单元格前后额外添加的间距。\(\textrm{@}\)
格式可以适当使用以充当“竖线”。特别地,\(\textrm{@\{\}}\)
可直接用来消除单元格前后的间距:
1
2
3
4
5
6
\begin {tabular}{@{} r@{:}lr @{}} \hline 1 & 1 & one \\ 11 & 3 & eleven \\ \hline \end {tabular}
另外还提供了简便的将格式参数重复的写法 \(\textrm*\{<n>\}\{<columnspec>\}\) ,比如以下两种写法是等效的:
1
2
\begin {tabular}{|c|c|c|c|c|p{4em}|p{4em}|}\begin {tabular}{|*{5}{c|}*{2}{p{4em}|}}
有时需要为整列修饰格式,比如整列改变为粗体,如果每个单元格都加上
\bfseries} 命令会比较麻烦。array
宏包提供了辅助格式 \(\textrm>\) 和
\(\textrm<\) ,用于给列格式前后加上修饰命令:
1 2 3 4 5 6 7 \begin {tabular}{>{\itshape }r<{*}l} \hline italic & normal \\ column & column \\ \hline \end {tabular}
辅助格式甚至支持插入 \centering 等命令改变 \(\textrm{p}\)
列格式的对齐方式,一般还要加额外的命令 \arraybackslash
以免出错。
1 2 3 4 5 6 7 \begin {tabular}{>{\centering \arraybackslash }p{9em}} \hline Some center-aligned long text. \\ \hline \end {tabular}
array 宏包还提供了类似 \(\textrm{p}\) 格式的 \(\textrm{m}\) 格式和 \(\textrm{b}\)
格式,三者分别在垂直方向上靠顶端对齐、居中以及底端对齐。
1 2 3 4 5 6 7 \newcommand \txt {a b c d e f g h i}\begin {tabular}{cp{2em}m{2em}b{2em}} \hline pos & \txt & \txt & \txt \\ \hline \end {tabular}
列宽
在控制列宽方面,\(\LaTeX{}\)
表格有着明显的不足:\(\textrm{l/c/r}\)
格式的列宽是由文字内容的自然宽度决定的,而 \(\textrm{p}\)
格式给定了列宽却不好控制对齐(可用 array
宏包的辅助格式),更何况列与列之间通常还有间距,所以直接生成给定总宽度的表格并不容易。
\(\LaTeX{}\) 本身提供了 \(\textrm{tabular*}\)
环境用来排版定宽表格,但是不太方便使用,比如要用到 \(\textrm{@}\)
格式插入额外命令,令单元格之间的间距为
\fill,但即使这样仍然有瑕疵:
1
2
3
4
5
6
\begin {tabular*}{14em}{@{\extracolsep {\fill }}|c|c|c|c|} \hline A & B & C & D \\ \hline a & b & c & d \\ \hline \end {tabular*}
tabularx 宏包提供了方便的解决方案。它引入了一个 \(\textrm{X}\) 列格式,类似 \(\textrm{p}\)
列格式,不过会根据表格宽度自动计算列宽,多个 \(\textrm{X}\) 列格式平均分配列宽。 \(\textrm{X}\) 列格式也可以用
array 里的辅助格式修饰对齐方式:
1 2 3 4 5 6 7 \begin {tabularx}{14em}{|*{4}{>{\centering \arraybackslash }X|}} \hline A & B & C & D \\ \hline a & b & c & d \\ \hline \end {tabularx}
横线
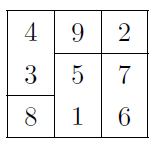
在之前的例子见过许多次绘制表格线的 \hline 命令。另外
\cline{<i>-<j>}
用来绘制跨越部分单元格的横线:
1
2
3
4
5
6
7
8
9
\begin {tabular}{|c|c|c|} \hline 4 & 9 & 2 \\ \cline {2-3} 3 & 5 & 7 \\ \cline {1-1} 8 & 1 & 6 \\ \hline \end {tabular}
image-20250115133628644
在科技论文排版中广泛应用的表格形式是三线表,形式干净简明。三线表由
booktabs 宏包支持,它提供了
\toprule、\midrule 和 \bottomrule
命令用以排版三线表的三条线,以及和 \cline 对应的
\cmidrule。除此之外,最好不要用其它横线以及竖线:
1 2 3 4 5 6 7 8 9 10 11 \begin {tabular}{cccc} \toprule & \multicolumn {3}{c}{Numbers} \\ \cmidrule {2-4} & 1 & 2 & 3 \\ \midrule Alphabet & A & B & C \\ Roman & I & II& III \\ \bottomrule \end {tabular}
合并单元格
横向合并单元格由 \multicolumn 命令实现:
1 \multicolumn {⟨n⟩}{⟨column-spec⟩}{⟨item⟩}
其中<n>
为要合并的列数,<column-spec>
为合并单元格后的列格式,只允许出现一个 \(\textrm{l/c/r}\) 或 \(\textrm{p}\)
格式。如果合并前的单元格前后带表格线 |,合并后的列格式也要带 |
以使得表格的竖线一致。
1
2
3
4
5
6
7
\begin {tabular}{|c|c|c|} \hline 1 & 2 & Center \\ \hline \multicolumn {2}{|c|}{3} & \multicolumn {1}{r|}{Right} \\ \hline 4 & \multicolumn {2}{c|}{C} \\ \hline \end {tabular}
上面的例子还体现了,形如 \multicolumn{1}{r|}{item}的命令
可以用来修改某一个单元格的列格式。
纵向合并单元格 需要用到 multirow
宏包提供的 \multirow 命令:
1 \multirow {⟨n⟩}{⟨width⟩}{⟨item⟩}
<width> 为合并后单元格的宽度,可以填 \(\textrm{*}\) 以使用自然宽度。
我们看一个结合 \cline、\multicolumn 和
\multirow 命令的例子:
1 2 3 4 5 6 7 8 9 \begin {tabular}{ccc} \hline \multirow {2}{*}{Item} & \multicolumn {2}{c}{Value} \\ \cline {2-3} & First & Second \\ \hline A & 1 & 2 \\ \hline \end {tabular}
嵌套表格
在以下的例子中,注意要用 \multicolumn 命令配合 \(\textrm{@\{\}}\)
格式把单元格的额外边距去掉,使得嵌套的表格线能和外层的表格线正确相连:
1
2
3
4
5
6
7
8
9
10
11
\begin {tabular}{|c|c|c|} \hline a & b & c \\ \hline a & \multicolumn {1}{@{}c@{}|} {\begin {tabular}{c|c} e & f \\ \hline e & f \\ \end {tabular}} & c \\ \hline a & b & c \\ \hline \end {tabular}
如果不需要为“拆分的单元格”画线,并且只在垂直方向“拆分”的话,makecell
宏包提供的 \makecell 命令是一个简单的解决方案:
1 2 3 4 5 6 7 8 \begin {tabular}{|c|c|} \hline a & \makecell {d1 \\ d2} \\ \hline b & c \\ \hline \end {tabular}
行距控制
\(\LaTeX{}\)
生成的表格看起来通常比较紧凑。修改参数 \arraystretch
可以得到行距更加宽松的表格。
1
2
3
4
5
6
7
\renewcommand \arraystretch {1.8}\begin {tabular}{|c|} \hline Really loose \\ \hline tabular rows.\\ \hline \end {tabular}\end {example}
另一种增加间距的办法是给换行命令 \\
添加可选参数,在这一行下面加额外的间距,适合用于在行间不加横线的表格:
1
2
3
4
5
6
7
\begin {tabular}{c} \hline Head lines \\ [6pt] tabular lines \\ tabular lines \\ \hline \end {tabular}
但是这种换行方式的存在导致了一个缺陷——从第二行开始,表格的首个单元格不能直接使用中括号
\(\textrm{[]}\) ,否则 \\
往往会将下一行的中括号当作自己的可选参数,因而出错。如果要使用中括号,应当放在花括号
{} 里面。或者也可以选择将换行命令写成 \(\textrm{\\\\[0pt]}\) 。
浮动体
内容丰富的文章或者书籍往往包含许多图片和表格等内容。这些内容的尺寸往往太大,导致分页困难。\(\LaTeX{}\)
为此引入了浮动体的机制,令大块的内容可以脱离上下文,放置在合适的位置。
\(\LaTeX{}\) 预定义了两类浮动体环境
\(\textrm{figure}\) 和 \(\textrm{table}\) 。习惯上 \(\textrm{figure}\) 里放图片,\(\textrm{table}\)
里放表格,但并没有严格限制,可以在任何一个浮动体里放置文字、公式、表格、图片等等任意内容。
以 \(\textrm{table}\)
环境的用法举例,\(\textrm{figure}\)
同理:
1
2
3
\begin {table}[⟨placement⟩]… \end {table}
<placement> 参数提供了一些符号用来表示浮动体允许排版的位置,如
\(\textrm{hbp}\)
允许浮动体排版在当前位置、底部或者单独成页。\(\textrm{table}\) 和 \(\textrm{figure}\) 浮动体的默认设置为 \(\textrm{tbp}\) 。
双栏排版环境下,\(\LaTeX{}\) 提供了
\(\textrm{table*}\) 和 \(\textrm{figure*}\) 环境用来排版
跨栏 的浮动体。用法与 \(\textrm{table}\) 和 \(\textrm{figure}\) 一样,不同之处为双栏的
<placement> 参数只能用 \(\textrm{tp}\) 两个位置。
浮动体的位置选取受到先后顺序的限制。如果某个浮动体由于参数限制、空间限制等原因在当前页无法放置,就要推迟到之后处理,并使得之后的同类浮动体一并推迟。\clearpage
命令会在另起一页之前,先将所有推迟处理的浮动体排版成页,此时 \(\textrm{htbp}\) 等位置限制被完全忽略。
float 宏包为浮动体提供了 \(\textrm{H}\) 位置参数,不与 \(\textrm{htbp}\) 及 \(\textrm{!}\) 混用。使用 \(\textrm{H}\)
位置参数时,会取消浮动机制,将浮动体视为一般的盒子插入当前位置。这在一些特殊情况下很有用(如使用
multicol
宏包排版分栏内容的时候),但尺寸过大的浮动体可能使得分页比较困难。
浮动体的标题
图表等浮动体提供了 \caption
命令加标题,并且自动给浮动体编号,可以用带星号的命令
\caption*(需加载相关宏包,如 caption)
生成不带编号的标题,也可以使用带可选参数的形式
\caption[...]{...},使得在目录里使用短标题。命令之后还可以紧跟
\label 命令标记交叉引用。
\caption 生成的标题形如“Figure 1: …”或“Table 1:
…”可通过修改 \figurename 和 \tablename
的内容来修改标题的前缀。标题样式的定制功能由 caption
宏包提供,详见该宏包的帮助文档,在此不作赘述。
\(\textrm{table}\) 和 \(\textrm{figure}\)
两种浮动体分别有各自的生成目录的命令:
1
2
\listoftables \listoffigures
它们类似 \tableofcontents 生成单独的章节。
将 Excel 表格转换为 LaTeX
代码
Excel2LaTeX 插件(推荐)
Table Generator 在线工具
pandoc(适合批量转换)
安装:
1
2
sudo apt install pandoc choco install pandoc
使用方法:
1 pandoc -f csv -t latex input.csv -o output.tex
特点 :适合从 CSV 文件批量转换。
Python 脚本(适合自定义需求)
1
2
3
4
5
6
import pandas as pdfrom tabulate import tabulatedf = pd.read_excel("your_file.xlsx" ) latex_code = tabulate(df, headers="keys" , tablefmt="latex" ) print (latex_code)
这些工具各有优缺点,如果是日常使用,推荐 Excel2LaTeX 或 Table
Generator 在线工具;如果是批量处理,可以考虑 Pandoc 或
Python 。
几种常见表格模板
导言区包含宏包和命令
1
2
3
4
5
6
7
8
9
10
11
12
13
14
15
16
\usepackage {booktabs} \usepackage {longtable}\usepackage {ltxtable}\usepackage {array} \usepackage {tabularx} \usepackage {multirow} \usepackage {siunitx} \usepackage {makecell}\usepackage {graphicx}\usepackage {diagbox}\usepackage {rotating}\usepackage {subcaption} \usepackage {float} \newcolumntype {L}{>{\raggedright \arraybackslash }X} \newcolumntype {C}{>{\centering \arraybackslash }X} \newcolumntype {R}{>{\raggedleft \arraybackslash }X}
普通三线表
1
2
3
4
5
6
7
8
9
10
11
12
13
14
15
16
17
\begin {table}[H] \centering \caption {Five different mesh densities.} \begin {tabular}{cccc} \toprule & Total cells & $ \mathrm {C}_ \mathrm {L}$ & $ \mathrm {C}_ \mathrm {D}$ \\ \midrule Mesh 1 & $ 33.45 \times 10^ 4$ & 0.5606 & 0.0225 \\ Mesh 2 & $ 103.24 \times 10^ 4$ & 0.5656 & 0.0202 \\ Mesh 3 & $ 200.16 \times 10^ 4$ & 0.5689 & 0.0197 \\ Mesh 4 & $ 305.47 \times 10^ 4$ & 0.5689 & 0.0197 \\ Mesh 5 & $ 412.66 \times 10^ 4$ & 0.5689 & 0.0197 \\ \bottomrule \end {tabular} \label {tab:commom} \end {table}
等页宽三线表
1
2
3
4
5
6
7
8
9
10
11
12
13
14
15
16
17
\begin {table}[H] \centering \caption {Five different mesh densities.} \begin {tabularx}{\linewidth }{CCCC} \toprule & Total cells & $ \mathrm {C}_ \mathrm {L}$ & $ \mathrm {C}_ \mathrm {D}$ \\ \midrule Mesh 1 & $ 33.45 \times 10^ 4$ & 0.5606 & 0.0225 \\ Mesh 2 & $ 103.24 \times 10^ 4$ & 0.5656 & 0.0202 \\ Mesh 3 & $ 200.16 \times 10^ 4$ & 0.5689 & 0.0197 \\ Mesh 4 & $ 305.47 \times 10^ 4$ & 0.5689 & 0.0197 \\ Mesh 5 & $ 412.66 \times 10^ 4$ & 0.5689 & 0.0197 \\ \bottomrule \end {tabularx} \label {tab:same_ textwidth} \end {table}
跨行跨列表格
1
2
3
4
5
6
7
8
9
10
11
12
13
14
15
16
17
18
19
20
21
\begin {table}[H] \centering \caption {跨行跨列表格} \renewcommand \arraystretch {1.6} \begin {tabular}{|c|c|c|c|c|} \hline \multicolumn {3}{|r|}{} & 转移特性曲线的象限 & 输出特性曲线的象限 \\ \hline \multicolumn {1}{|c|}{\multirow {4}[4]{*}{\rotatebox {90}{结型场效应管}}} & \multicolumn {2}{c|}{\multirow {2}[2]{*}{N沟道}} & \multicolumn {1}{c|}{\multirow {2}[2]{*}{2}} & \multirow {2}[2]{*}{1} \\ & \multicolumn {2}{c|}{} & \multicolumn {1}{c|}{} & \\ \cline {2-5} & \multicolumn {2}{c|}{\multirow {2}[2]{*}{P沟道}} & \multicolumn {1}{c|}{\multirow {2}[2]{*}{4}} & \multirow {2}[2]{*}{3} \\ & \multicolumn {2}{c|}{} & \multicolumn {1}{c|}{} & \\ \hline \multicolumn {1}{|c|}{\multirow {4}[8]{*}{\begin {turn}{90}{绝缘栅型场效应管}\end {turn}}} & \multicolumn {1}{c|}{\multirow {2}[4]{*}{N沟道}} & 增强型 & \multicolumn {1}{c|}{2} & 1 \\ \cline {3-5} & & 耗尽型 & 1,2 & 1 \\ \cline {2-5} & \multicolumn {1}{c|}{\multirow {2}[4]{*}{P沟道}} & 增强型 & \multicolumn {1}{c|}{3} & 3 \\ \cline {3-5} & & 耗尽型 & 2,4 & 3 \\ \hline \end {tabular} \label {tab:addlabel} \end {table}
表格中包含图
1
2
3
4
5
6
7
8
9
10
11
12
13
14
15
\begin {table}[H]\centering \caption {表格中包含图}\begin {tabular}{|c|c|}\hline 文字 & \begin {minipage}[c][5cm]{8cm} \includegraphics [width=8cm]{tree.png} \end {minipage} \\ \hline 跨页 & 表格 \\ \hline \end {tabular}\label {tab:fig_ in_ tab}\end {table}
跨页长表格
1
2
3
4
5
6
7
8
9
10
11
12
13
14
15
16
17
18
19
20
21
22
23
24
25
26
27
28
29
30
31
32
33
34
35
36
37
38
39
40
41
42
43
44
45
\begin {center}\begingroup \small \begin {longtable}{lccccc}\caption {跨页长表格}\label {tab:long1} \\ \toprule \textbf {家庭特征} & \textbf {续发病例数(例)} & \textbf {家庭密接数(例)}& \makecell {\textbf {家庭二代续发率}\\ \textbf {[\% (95\% CI)]}} & \textbf {$ x^ 2$ 值} & \textbf {P值} \\ \midrule \endfirsthead \multicolumn {6}{c}{表~\ref {tab:long1}(续)}\\ \toprule \textbf {家庭特征} & \textbf {续发病例数(例)} & \textbf {家庭密接数(例)}& \makecell {\textbf {家庭二代续发率}\\ \textbf {[\% (95\% CI)]}} & \textbf {$ x^ 2$ 值} & \textbf {P值} \\ \midrule \endhead \bottomrule \endfoot \bottomrule \endlastfoot 总体蓄发率 & 201 & 477 & 42.14 (37.69,46.72) & & \\ 发生传播家庭蓄发率 & 201 & 477 & 42.14 (37.69,46.72) & & \\ 家庭结构 & & & & 0.309 & 0.636 \\ 二代户 & 83 & 190 & 43.68 (36.57,51.05) & & \\ 三代户 & 118& 287 & 41.11 (35.40,47.06) & & \\ 家庭规模 & & & & 5.191 & 0.027 \\ 总体蓄发率 & 201 & 477 & 42.14 (37.69,46.72) & & \\ 发生传播家庭蓄发率 & 201 & 477 & 42.14 (37.69,46.72) & & \\ 家庭结构 & & & & 0.309 & 0.636 \\ 二代户 & 83 & 190 & 43.68 (36.57,51.05) & & \\ 三代户 & 118& 287 & 41.11 (35.40,47.06) & & \\ 家庭规模 & & & & 5.191 & 0.027 \\ 总体蓄发率 & 201 & 477 & 42.14 (37.69,46.72) & & \\ 发生传播家庭蓄发率 & 201 & 477 & 42.14 (37.69,46.72) & & \\ \end {longtable}\endgroup \end {center}
跨页长表格宽度设置为页面宽度
这里需要采用分文件写法,将表格内容放到set_table_width.tex文件中,在主文件中插入如下代码,其中\textwidth控制表格宽度。
1 \LTXtable {\textwidth }{set_ table_ width.tex}
下面的内容单独放到set_table_width.tex中。
1 2 3 4 5 6 7 8 9 10 11 12 13 14 15 16 17 18 19 20 21 22 23 24 25 26 27 28 29 30 31 32 33 34 35 36 37 38 39 40 41 42 43 44 45 46 47 48 49 50 51 52 53 54 55 56 57 58 \begingroup \small \begin {longtable}{LCCC}\caption {跨页长表格设置宽度}\label {tab:set_ width} \\ \toprule \textbf {家庭特征} & \makecell {\textbf {发生家庭传播(n=99)}\\ \textbf {[户,百分比(\% )]}} & \makecell {\textbf {未发生家庭传播(n=57)}\\ \textbf {[户,百分比(\% )]}}& \makecell {\textbf {总计(n=156)}\\ \textbf {[户,百分比(\% )]}} \\ \midrule \endfirsthead \multicolumn {4}{c}{表~\ref {tab:set_ width}(续)}\\ \toprule \textbf {家庭特征} & \makecell {\textbf {发生家庭传播(n=99)}\\ \textbf {[户,百分比(\% )]}} & \makecell {\textbf {未发生家庭传播(n=57)}\\ \textbf {[户,百分比(\% )]}}& \makecell {\textbf {总计(n=156)}\\ \textbf {[户,百分比(\% )]}} \\ \midrule \endhead \bottomrule \endfoot \bottomrule \endlastfoot 家庭结构 & ~ & ~ & ~ \\ ~ ~ 二代户 & 47(47.5\% ) & 29(50.9\% ) & 76(48.7\% ) \\ ~ ~ 三代户 & 52(52.5\% ) & 28(49.1\% ) & 80(51.3\% ) \\ 家庭规模 & ~ & ~ & ~ \\ ~ ~ 2\textasciitilde {}3 & 27(27.3\% ) & 29(50.9\% ) & 56(35.9\% ) \\ ~ ~ 4\textasciitilde {}5 & 60(60.6\% ) & 26(45.6\% ) & 86(55.1\% ) \\ ~ ~ 6+ & 12(12.1\% ) & 2(3.5\% ) & 14(9.0\% ) \\ 住房类型 & ~ & ~ & ~ \\ ~ ~ 楼房 & 74(74.7\% ) & 41(71.9\% ) & 115(73.7\% ) \\ ~ ~ 平房 & 22(22.2\% ) & 15(26.3\% ) & 37(23.7\% ) \\ ~ ~ 其他 & 3(3.0\% ) & 1(1.8\% ) & 4(2.6\% ) \\ 人均住房面积(㎡) & ~ & ~ & ~ \\ ~ ~ ≤20 & 22(22.2\% ) & 10(17.5\% ) & 32(20.5\% ) \\ ~ ~ 20-40 & 58(58.6\% ) & 36(63.2\% ) & 94(60.3\% ) \\ ~ ~ ≥40 & 19(19.2\% ) & 11(19.3\% ) & 30(19.2\% ) \\ 家庭人均年收入(元) & ~ & ~ & ~ \\ ~ ~ 5000 & 3(3.0\% ) & 0(0\% ) & 3(1.9\% ) \\ ~ ~ 5000-19999 & 9(9.1\% ) & 6(10.5\% ) & 15(9.6\% ) \\ ~ ~ 20000-49999 & 18(18.2\% ) & 9(15.8\% ) & 27(17.3\% ) \\ ~ ~ 50000-99999 & 29(29.3\% ) & 15(26.3\% ) & 44(28.2\% ) \\ ~ ~ ≥100000 & 40(40.4\% ) & 27(47.4\% ) & 67(42.9\% ) \\ 吸烟家庭 & ~ & ~ & ~ \\ ~ ~ 是 & 57(57.6\% ) & 26(45.6\% ) & 83(53.2\% ) \\ ~ ~ 否 & 42(42.4\% ) & 31(54.4\% ) & 73(46.8\% ) \\ 家庭地区 & ~ & ~ & ~ \\ ~ ~ 富阳地区 & 20(20.2\% ) & 21(36.8\% ) & 41(26.3\% ) \\ ~ ~ 嘉兴地区 & 29(29.3\% ) & 6(10.5\% ) & 35(22.4\% ) \\ ~ ~ 丽水地区 & 34(34.3\% ) & 14(24.6\% ) & 48(30.8\% ) \\ ~ ~ 温州地区 & 16(16.2\% ) & 16(28.1\% ) & 32(20.5\% ) \end {longtable}\endgroup
并排表格
1
2
3
4
5
6
7
8
9
10
11
12
13
14
15
16
17
18
19
20
21
22
23
24
25
26
27
28
29
30
31
32
33
34
35
36
37
38
39
40
\begin {table}[htbp] \centering \begin {minipage}[t]{0.7\textwidth } \centering \caption {道路资源花费}\label {tab:left} \vspace *{-.5\baselineskip }{\small Table~\ref {tab:left}\ \ Road resource cost} \\ [.5\baselineskip ] \tabcolsep 15pt \begin {tabularx}{\linewidth }{CCCCCCCC} \hline $ e_ {l}$ & $ e_ {1}$ & $ e_ {2}$ & $ e_ {3}$ & $ e_ {4}$ & $ e_ {5}$ & $ e_ {6}$ & $ e_ {7}$ \\ \hline $ c_ {l}(1)$ & 1 & 2 & 2& 3 & 2 & 2 & 1\\ \hline $ c_ {l}(2)$ & 3 & 3 & 4& 5 & 4 & 4 & 5\\ \hline $ c_ {l}(3)$ & 5 & 6 & 7& 7 & 6 & 6 & 7\\ \hline \end {tabularx} \end {minipage} \hfill \begin {minipage}[t]{0.26\textwidth } \centering \caption {充电资源花费}\label {tab:right} \vspace *{-.5\baselineskip }{\small Table~\ref {tab:right}\ \ Charing resource cost} \\ [.5\baselineskip ] \tabcolsep 15pt \begin {tabularx}{\linewidth }{CCC} \hline $ r_ {m}$ & $ r_ {1}$ & $ r_ {2}$ \\ \hline $ \xi _ {m}(1)$ & 2 & 3 \\ \hline $ \xi _ {m}(2)$ & 6 & 8 \\ \hline $ \xi _ {m}(3)$ & 7 & 10 \\ \hline \end {tabularx} \end {minipage} \end {table}
并排子表格
1
2
3
4
5
6
7
8
9
10
11
12
13
14
15
16
17
18
19
20
21
22
23
24
25
26
27
28
29
30
31
32
33
34
\begin {table}[htbp] \centering \begin {subtable}[t]{0.48\textwidth } \centering \begin {tabular}{|c|c|} \hline 项目 & 值 \\ \hline A & 1 \\ B & 2 \\ \hline \end {tabular} \caption {子表A} \label {tab:subA} \end {subtable} \hfill \begin {subtable}[t]{0.48\textwidth } \centering \begin {tabular}{|c|c|c|} \hline 项目 & 值 & 备注 \\ \hline X & 10 & 测试 \\ Y & 20 & 示例 \\ \hline \end {tabular} \caption {子表B} \label {tab:subB} \end {subtable} \caption {并排子表示例} \label {tab:main} \end {table}